My First Week Completely Off-Grid: Real Solar Performance Data From South Africa
After Eskom disconnected my supply on 29 May 2026 during an unresolved billing dispute, I made the decision to operate my home completely independently from the grid. I had a Deye 5kW hybrid inverter, a Dyness PowerBrick Plus 16kWh battery, and approximately 5.7kW of JA Solar panels across two strings on an elevated pergola structure — a system that had evolved incrementally over three years but had never been asked to function as my sole power source. And it was June. South African winter. On a forested, heavily shaded property in KZN.
What followed was one of the most instructive weeks of my entire solar journey. I monitored everything through SolarmanPV telemetry at 5-minute intervals from the first moment of disconnection, and the data tells a story that is considerably more positive — and more nuanced — than I expected going in.
The System Going In
Before getting into the numbers, it is worth being specific about what the system actually is, because "hybrid inverter plus battery plus panels" covers an enormous range of capability. The Deye 5kW handles the conversion and management. The Dyness 16kWh provides the storage — a significant upgrade from the original 5kWh Volta battery that preceded it. The panel array sits across two strings on an elevated pergola structure that I built specifically to raise the panels above the surrounding treeline, with the second string mounted higher than the first to reduce morning shading losses. The property is heavily forested, which means winter production is materially affected by both lower sun angles and physical obstruction from vegetation that was managed but not eliminated.
This is not a clean suburban rooftop installation. It is a system engineered around a difficult site, and the data below reflects those constraints honestly.
Eight Days of Real Data
The table below is drawn directly from SolarmanPV telemetry — actual 5-minute interval readings, not estimates or averages from theoretical models.
| Date |
Start SoC |
Overnight Low |
Peak Production |
Peak SoC Reached |
Conditions |
| 13 Jun |
56% |
35% |
3,794W at 11:15 |
100% by 13:45 |
Good — battery fully charged by early afternoon |
| 14 Jun |
78% |
8%* |
3,105W at 10:35 |
52% by 14:15 |
BMS calibration event — see note below |
| 15 Jun |
49% |
22% |
3,152W at 10:15 |
66% by 15:00 |
Good recovery from low starting point |
| 16 Jun |
49% |
39% |
1,158W at 11:35 |
53% by 15:00 |
Heavy cloud — lowest output of the week |
| 17 Jun |
40% |
31% |
2,645W at 11:05 |
72% by 14:50 |
Good — solid recovery from low base |
| 18 Jun |
53% |
40% |
2,542W at 11:10 |
85% by 14:20 |
Very good — strongest recharge day |
| 19 Jun |
66% |
52% |
2,724W at 12:10 |
86% by 13:15 |
Good — system building overnight reserves |
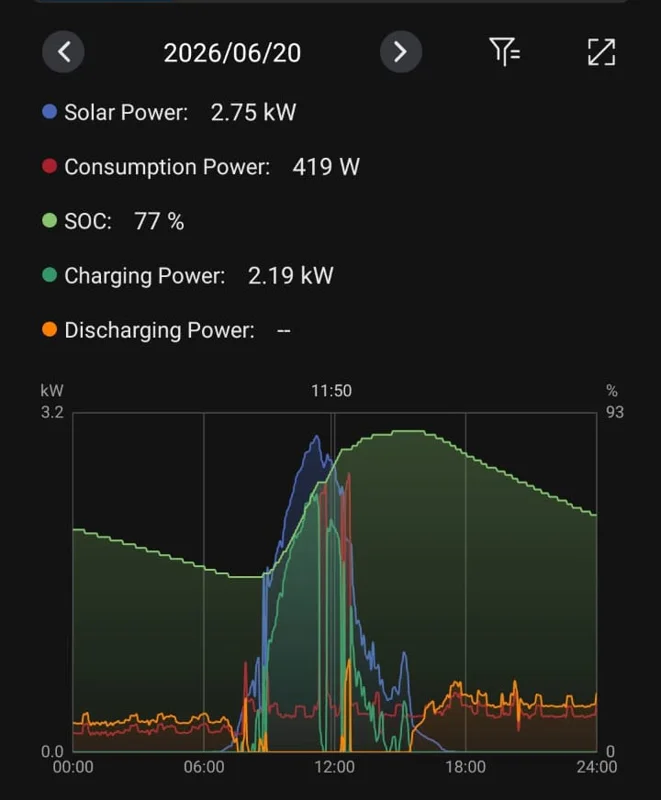
| 20 Jun |
62% |
49% |
2,985W by 11:10 |
86% by 13:30 |
Good — still charging at time of writing |
* The 8% SoC reading on 14 June requires explanation. The data shows SoC apparently collapsing from 100% to 8% in a very short window, with no corresponding consumption spike in the telemetry that could explain such rapid depletion. This is almost certainly a BMS recalibration event — a documented behaviour in LiFePO4 systems during early cycling where the BMS resets its capacity baseline. The system continued operating normally throughout. I am documenting it here precisely because these anomalies appear alarming when you first see them and are worth understanding rather than hiding.
What the Numbers Actually Tell You
The single most striking figure across eight days of data is the one that appears in every single row of the grid purchasing column: 0.00 watts. In 5-minute intervals from the moment of disconnection through to today, not once has the system drawn power from the grid. That is not a claim or an aspiration. It is logged telemetry data from a winter installation on a shaded forested property.
The overnight battery behaviour is where the system truly proved itself. Between midnight and approximately 06:15 — the point at which the first trace of solar production appears — the system runs exclusively on stored battery power. Base overnight load during quiet hours averaged 70–80 watts, with the battery discharging at 130–140 watts to deliver that (the gap reflects BMS management overhead and the inverter's own standing draw). From early evening through to midnight, when the household was actively being used, consumption ranged from 150 to around 500 watts for normal activity, with occasional spikes to 2,300–2,400 watts when larger appliances ran. Across a full overnight cycle the battery typically gave up 15–21% of its 16kWh capacity — equivalent to approximately 2.4 to 3.4 kWh — and solar had it recovering strongly by 09:00 on most days.
The lowest SoC reached in normal operation was 22% on the morning of 15 June. That was after an overnight starting from 49%, with a household that was being used normally. The system handled it without complaint and had the battery back to 66% by mid-afternoon. On 19 June — seven days in — the overnight low was 52%, which tells you something important about how the system's effective reserve builds as it finds its rhythm across consecutive good-weather days.
The Shading Reality in the Data
The production variance between days is the most honest illustration of what shading on a forested property actually costs you. On 13 June, with relatively clear winter skies, the system peaked at 3,794W and had the battery at 100% by 13:45. On 16 June, under heavy cloud, the same system peaked at 1,158W — less than a third of the clear-day output — and ended the night with the battery at only 40% SoC. Same system, same panels, same site. The difference is entirely weather and light conditions.
This is not a failure of the system design. It is an honest representation of what winter solar on a shaded South African property looks like, and it is the primary reason why the planned generator integration remains on the upgrade list. For extended overcast periods — more than two or three consecutive days at 16 June-type production — the system would eventually need supplementary input. One bad week is not a crisis with 16kWh of storage behind you, but it would eventually test the limits without a backup source.
What the First Week Changed
The technical performance was better than I expected. The psychological shift was larger than I anticipated. When your solar system is a backup to the grid, watching the battery SoC is interesting. When it is your only power source, watching it becomes something closer to instinctive — you are aware of cloud cover in a way you never were before, you notice the production numbers climbing in the morning with something resembling relief, and you understand intuitively when to run the kettle and when to wait.
That awareness is not anxiety, at least not after the first few days. It becomes something more like literacy — an understanding of your own energy situation that grid-connected households simply do not develop. Whether that is worth the R141,320 the system has cost to build is a question I address in the full cost breakdown article. What I can say from one week of data is that the system works, the numbers are real, and the grid power purchased column has not moved off zero.
Key Takeaways for Anyone Considering a Similar Transition
Hybrid systems can absolutely operate off-grid, but battery capacity matters far more than most pre-purchase discussions acknowledge. The difference between a 5kWh and a 16kWh battery is not just runtime — it is the difference between a system that requires constant management and one that operates with genuine confidence. The inverter size is almost secondary to that question.
Winter is where your system design gets tested honestly. Summer production flatters almost any installation. If your system can hold its own through June and July on a shaded South African property — which mine has, with real telemetry data to prove it — then you have a system genuinely capable of year-round independence. Do not finalise your system design based on summer projections alone.
The shading problem is not solved once. It requires ongoing management — structural, arboricultural, and positional. The pergola extension and elevated mounting made a measurable difference to production on this property. But trees continue growing, and that is a recurring consideration rather than a one-off fix.
All telemetry data referenced in this article is drawn from SolarmanPV 5-minute interval readings from 13 June 2026 onward. This article is for informational purposes only. All solar electrical installations must comply with SANS 10142 and be carried out by a registered electrician. Visit our installer directory to find verified professionals in your area.